
Algebra Mathematics
Venn Diagrams
A Venn Diagram is a diagram for finite group of sets that displays all of the categories of elements. For example, given these sets
- A = { 1, 2, 3, 4 }
- B = { 2, 4, 6 }
we can use this Venn Diagram representation:
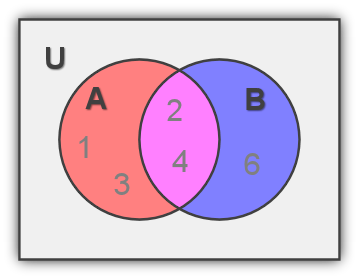
The outer set U is the universal set and represents the entire universe of elements that we will work in. In most mathematics courses, the universal set is taken to be the set of real numbers. Notice that we have distinct regions for each category of elements and each region has a different color. For example, the elements that are in both A and B are magenta.
Abstract Diagrams
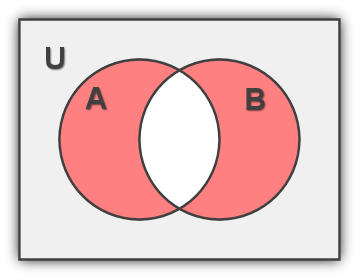
Venn diagrams are often used to depict regions for abstract sets. In this case, we are only interested in displaying set regions.
Implied Universal Set
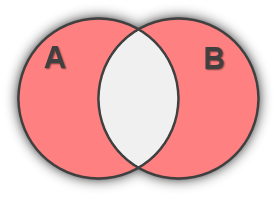
Generally, the universal set will be eliminated from the diagram. In this case, the universal set will be implied and will usually be the real numbers.
More than Two Sets
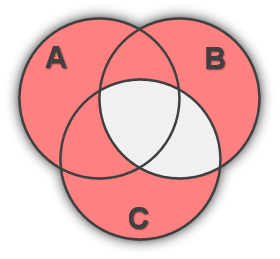
We can make Venn Diagrams for more than two sets. However, it is uncommon to use Venn Diagrams for more than three sets because they lose their intuitive appeal.
© 2007–2026 XoaX.net LLC. All rights reserved.