
GDI+ C++
Lines
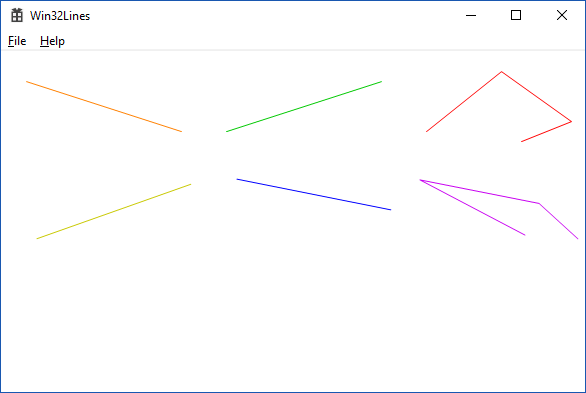
Lines can be created via six different function calls in GDI+. Coordinates can be specified as integers or floating-point numbers, and each method has three corresponding function calls. For either of these, two of the methods draw a single line and the third can be used to draw a continuous set of lines. The six different methods are illustrated in the program that we have written, and each one corresponds to a line or a string of lines that we have displayed in the output.
For single line drawing, we can specify the points in coordinates or point objects. The integer coordinates are specified as INT type, while the floating-point coordinates are specified as REAL type. These correspond to the native int and float types. The point types are Point for integers and PointF for the floating-point type; each has two coordinates.
The code that we use illustrates each of the six methods for drawing lines. First, we use the integer coordinate method to draw an orange line. Next, we use a green pen to draw a line using two integer points. Third, we use a red pen to draw three continuous lines using an array of four integer points. Fourth, we use a yellow pen to draw a line using floating point coordinates. Fifth, we use a blue pen to draw a line using floating-point based points. Finally, the sixth command draws a string of three lines in purple, using an array of floating-point points.
The drawing code is given here.
	Graphics graphics(hdc);
	// This makes the drawing smooth, rather than jagged.
	graphics.SetSmoothingMode(Gdiplus::SmoothingModeHighQuality);
	// Pens have ARGB color channels and line width parameters
	// Line 1 - Integer coordinates
	Pen qOrangePen(Color(255, 255, 128, 0), 1.0);
	graphics.DrawLine(&qOrangePen, 25, 30, 180, 80);

	// Line 2 - Integer points
	Pen qGreenPen(Color(255, 0, 200, 0), 1.0);
	graphics.DrawLine(&qGreenPen, Point(225, 80), Point(380, 30));

	// Lines 1 - An array of integer points
	Pen qRedPen(Color(255, 255, 0, 0), 1.0);
	Point qaPoints[4] = { Point(425, 80), Point(500, 20),
		Point(570, 70), Point(520, 90) };
	graphics.DrawLines(&qRedPen, qaPoints, 4);

	// Line 3 - Floating-point coordinates
	Pen qYellowPen(Color(255, 200, 200, 0), 1.0);
	graphics.DrawLine(&qYellowPen, 35.3f, 187.1f, 189.3f, 132.6f);

	// Line 4 - Floating-point points
	Pen qBluePen(Color(255, 0, 0, 255), 1.0);
	graphics.DrawLine(&qBluePen, PointF(235.3, 127.5), PointF(389.3, 158.2));

	// Lines 2 - An array of floating-point points
	Pen qPurplePen(Color(255, 200, 0, 240), 1.0);
	PointF qaPointsF[4] = { PointF(523.5, 183.5), PointF(418.3, 128.2),
		PointF(537.5, 151.8), PointF(576.4, 187.3) };
	graphics.DrawLines(&qPurplePen, qaPointsF, 4);
- Integer coordinates
Pen qOrangePen(Color(255, 255, 128, 0), 1.0);
graphics.DrawLine(&qOrangePen, 25, 30, 180, 80);
- Integer points
Pen qGreenPen(Color(255, 0, 200, 0), 1.0);
graphics.DrawLine(&qGreenPen, Point(225, 80), Point(380, 30));
- An array of integer points
Pen qRedPen(Color(255, 255, 0, 0), 1.0); Point qaPoints[4] = { Point(425, 80), Point(500, 20), Point(570, 70), Point(520, 90) }; graphics.DrawLines(&qRedPen, qaPoints, 4); - Floating-point coordinates
Pen qYellowPen(Color(255, 200, 200, 0), 1.0);
graphics.DrawLine(&qYellowPen, 35.3f, 187.1f, 189.3f, 132.6f);
- Floating-point points
Pen qBluePen(Color(255, 0, 0, 255), 1.0);
graphics.DrawLine(&qBluePen, PointF(235.3, 127.5), PointF(389.3, 158.2));
- An array of floating-point points
Pen qPurplePen(Color(255, 200, 0, 240), 1.0);
PointF qaPointsF[4] = { PointF(523.5, 183.5), PointF(418.3, 128.2),
	PointF(537.5, 151.8), PointF(576.4, 187.3) };
graphics.DrawLines(&qPurplePen, qaPointsF, 4);
The six line drawing commands are given below and are color coded.
© 2007–2026 XoaX.net LLC. All rights reserved.